To journey in Twitter canoes: Methods to understand the mechanisms and meaning in Twitter conversations
Seema Rao, Brilliant Idea Studio, USA, Robert Stein, American Alliance of Musuems, USA
Abstract
Twitter, the microblogging service in which users share ideas in140-character increments (or 280-character increments after late September 2017), hosts approximately 500 million new tweets each day. While the field of social network analysis is quite advanced, only limited research has been conducted into discipline-specific networks (Espinos, 2017 and Espinos, 2015). Across the museum field, colleagues have used Twitter as a primary discovery source for professional networks and literature since the birth of the service, but more recently, we’ve begun witnessing conversational phenomenon emerging as an important factor for knowledge sharing. These conversations, known as "Twitter canoes" have been only lightly researched to date, but are prominent among the museum community. This paper will use two such canoes that occurred in 2017 between museums professionals to explore mechanisms for mapping tweets, methods for extrapolating meaning, and the possible future uses of Twitter canoes in museum work. The paper will also suggest potentially meaningful network metrics that might help identify and automate the detection of these conversations among twitter users. The authors anticipate that these methods could also be usefully extended to other social networks.Keywords: Social Media, Twitter, Data Analysis, Museum Trends
Introduction
Twitter, the microblogging service in which users share ideas in 140-character increments (or 280-character increments after late September 2017), hosts approximately 500 million new tweets each day. While the field of social network analysis is quite advanced, only limited research has been conducted into discipline-specific networks, including the field of museums (Espinos, 2016 and Espinos, 2015).
Across the museum field, colleagues have used Twitter as a primary discovery source for professional networks and literature since the birth of the service, but more recently, we’ve seen conversational phenomenon emerging as an important factor for knowledge sharing. These conversations, known as “Twitter canoes”have been only lightly researched to date, but are prominent among the museum community. The term “Twitter canoe,” purportedly coined by Lindsey Webber of Vulture.com in 2012 (Becket, 2013), refers to a conversational dialog on the microblogging platform that contains multiple simultaneous user accounts within a single tweet. When too many accounts piggyback on the conversation, the canoe sinks.
This paper will study two such canoes that occurred in 2017 between museums professionals, in order to explore mechanisms for mapping tweets, methods for extrapolating meaning, and the possible future uses of Twitter canoes in museum work. The paper will express how Twitter analysis can be a useful tool to understand specialized, self-formed communities, such as global museum professionals. The paper will also suggest potentially meaningful network metrics that might help identify and automate the detection of these conversations among Twitter users. The authors anticipate that these methods could also be usefully extended to other social networks.
On Twitter
Twitter is a global microblogging service with 330 million monthly active users as of the Q3 2017 (Statista, 2017). Unlike other social media sites, Twitter has a particularly high level (94.6 %) of publicly accessible accounts, with their messages meant to be shared widely (Page, 2017). This broadcast nature arguably fosters debate and conversation, often between strangers. While the service is asynchronous by design, users often employ the service to have conversations that unfold in real time.
The character limit of the service (originally 140 characters and now 280 characters) has given rise to specific linguistic innovations. The microblogging format forces users to parse their ideas into succinct elements, often stringing a narrative over multiple tweets. Users often deviate considerably from standard grammar. Visual imagery plays an integral part in communication, both in the form of GIFs and emojis. Overall, these features often have the effect of eliminating many of the personal narratives that occur in other blog formats (Murthy, 2013).
Messages often including metadata tags called hashtags. These hashtags can be placed at the end of a statement or within a statement. As hashtags serve to link a set of tweets to a common concept, these user-generated hashtags are often used to develop a sort of topic-specific Twitter chat. Hashtags are often used to support visibility. Users often avoid hashtags for more intimate conversations; these non-hashtagged conversations are more likely to spark conversations with a user’s followers (Zappavigna, 2015).
While conversational dialog, or Twitter canoes, have existed on Twitter through its history, in March 2017, the microblogging service transformed the ways that these conversations were occurring on their platform. Previously, the Twitter handle of each participant was included in the 140-character limit per tweet. The Spring 2017 change removed twitter handles from the character limit, effectively increasing the number of participants in the conversation to 50 users. Twitter founder Jack Dorsey explained that the change allowed users to “focus on the text of a conversation instead of addressing syntax” (Scarola, 2017). Therefore, Twitter canoes have become an increasingly important phenomenon to understand.
Finally, the services public-by-default communication style opens the possibility of harvesting, discovering, and following behaviors that are unique among other social networks. Taken together, Twitter is a simple and efficient way to interrogate interests of like-minded individuals in plain view of the whole field.
Conversation and networked sharing
The study of social network analysis has been rich and varied over decades, and offers many techniques and insights that can be applied to the analysis and meaning found in social media networks today. As early as 1967, Stanley Milgram described the effects of self-organizing networks on knowledge transmission and information discovery. Today, we see that social networks are a vast manifestation of these early observations. Despite the fact that it often seems that our social networks contain links and references to every possible emerging topic, studies show that the self-selection biases inherent in how we form our social networks also inherently bias the kinds of information we receive from those networks.
The saying “birds of a feather flock together“ is true for the homophyly that exists in our chosen social networks. Many studies of this phenomenon have shown that it is far less likely for dissimilar people to be connected on these networks than those who are similar in their reading, opinions, social status, etc. (McPherson et al., 2001; Schantl, et. al, 2013). Many of us have felt the impact of these filter bubbles in our own personal discovery behaviors online.
These factors give rise to important questions for museums to consider about the way in which we understand our audiences, navigate nuanced communication about topics that may be difficult or unpopular, and provide an open space for debate, conversation, and a safe space to share divergent opinions. In order to counteract inherent bias in our communication channels, we must first better understand and detect how conversational behaviors emerge and differ from less thoughtful content.
As discussed above, Twitter provides a fertile platform for us to explore behaviors in public that likely exist in other channels as well, but are harder to observe and study. Scholars have tested numerous methods to analyze the content of tweets, uncovering many challenges as a result. These methods often struggle to disambiguate granular expressions of emotion and sometimes misinterpret the meaning of the tweet due to misreading the tone of the text (Bryant & Cios, 2017; Mohammed & Kiritchenko, 2014; Pak & Paroubek, 2010; Patodkar et al., 2016). The syntax of Twitter conversations can also complicate interpretation. Part of speech analysis—a common approach for textual analysis—is not useful, as authors frequently drop subjects in order to maximize scant character space (Kouloumpis et al., 2011). Finally, Twitter users often share their ideas without implicit, rather than obviously, emotional language. With these challenges in mind, this article suggests a diverse plan to explore the content and meaning of two conversations held on Twitter between various museum professionals.
Study methods
This research focused on two Twitter chats as a means of testing possible methodologies that could assist museum professionals in understanding the nature of these emergent conversations. The first chat (Chat A) took place between July 5 and July 7, 2017. 38 unique users exchanged 468 tweets. The second conversation (Chat B) occurred between August 22 and August 23, 2017. 18 users posted 228 tweets during the chat.
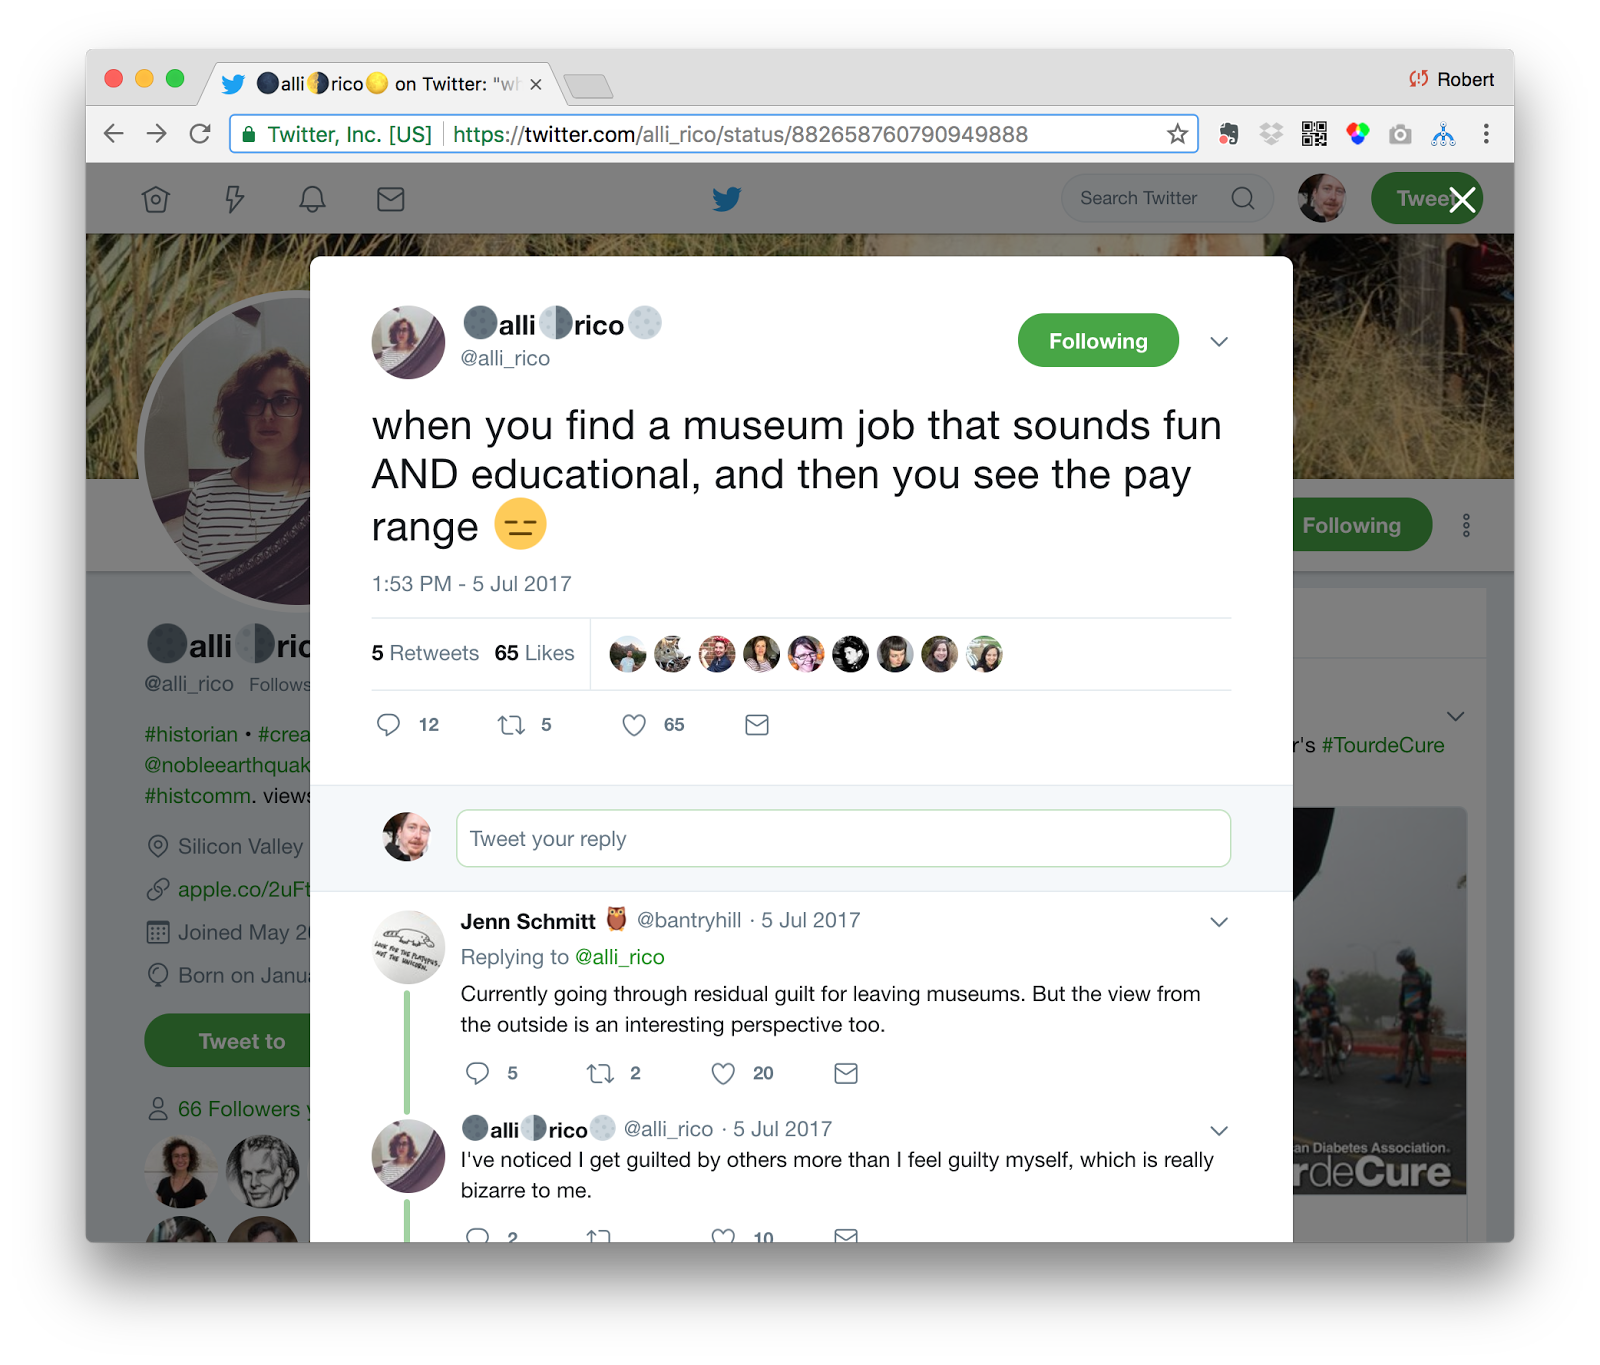
Chat A was initiated in a tweet by @alli_rico about the low pay that is offered in many museum positions. The discussion progressed to highlight difficulties of low salaries across the field, and the effects they have on museum professionals–often causing them to leave the field entirely.
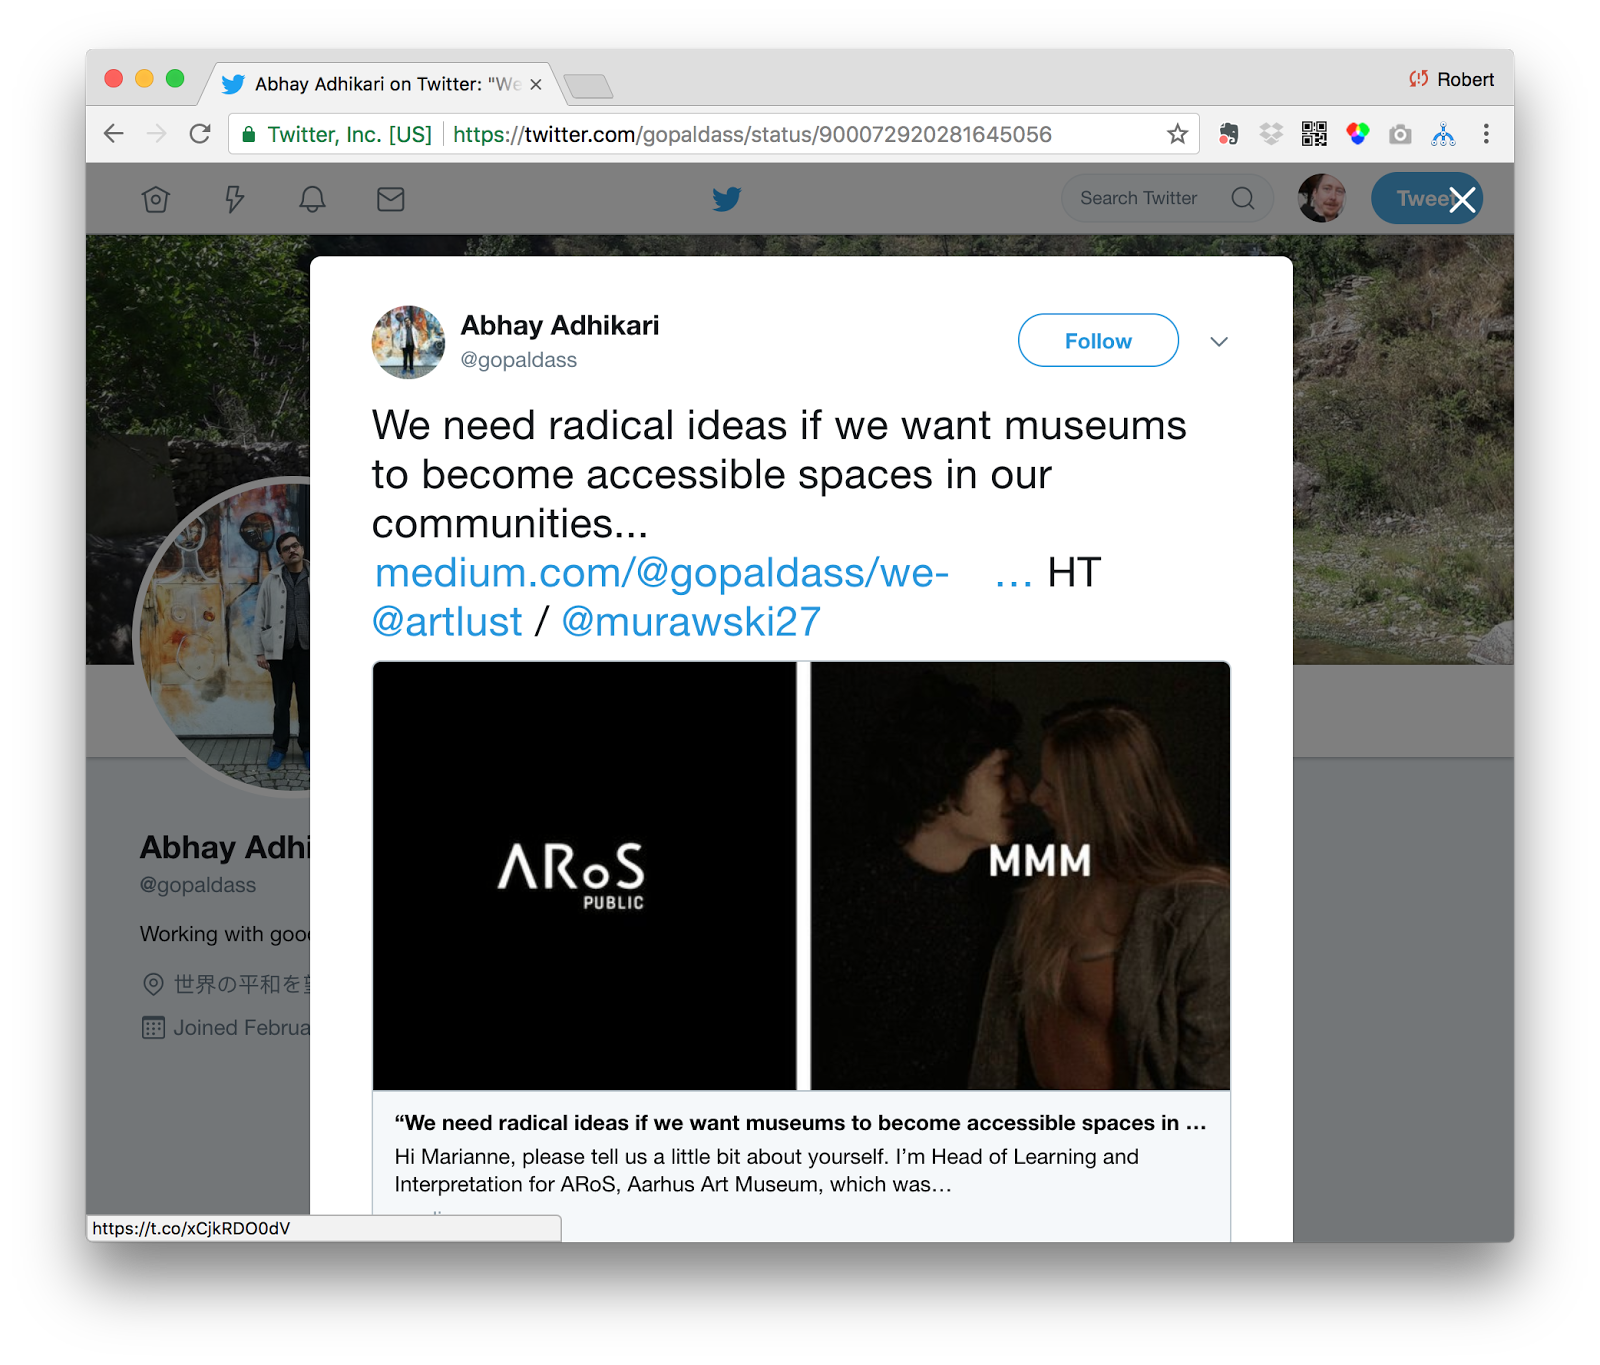
Chat B, on the other hand, was initiated by a tweet that shared an article on Medium about how museums need to provide safe and accessible spaces for radical ideas to be shared freely. It’s interesting to note that while in Chat A, the initiating user @alli_rico was an integral part of the conversation from beginning to end, in Chat B, @gopaldass was the instigator of a discussion that evolved wildly from his initiating tweet.
Harvesting and visualizing conversations on Twitter
Although Twitter is an ideal platform for analyzing conversation on social media, it is not without its problems and challenges. Chief among them is that tweets on the platform can only be harvested from the systems APIs for a period of seven days. After that period, those tweets are available individually through Twitter’s user interface, they are not available programmatically. Archives of tweets are available for sale via a small number of Twitter-approved merchants, but–especially for the purposes of study in the museum-field–the price of access to those archives is prohibitive.
Thus, we are left with a need to harvest discussions from the service contemporaneously with their occurrence. While conversations that span a few days time are still able to be retrieved – those that happened last week would no longer be available. This requires those studying the topic to be prepared to seize upon conversations as they happen and should motivate the sector to develop tools that might alert social media managers about emergent conversations as they begin to bud.
Additionally, Twitter imposes rate limits on the use of its APIs which means that extremely large and active conversations may easily exceed the rate limits allowed for naive implementations of harvesting schemes. (This author unsuccessfully attempted to download the explosive twitter conversation surrounding President Trump’s tweet of the word covfefe.)
While hashtags are often used by Twitter users to associate their tweets with a concept, event, or brand, more dialogic conversations frequently do not use a common hashtag, thereby making them harder to track. Other studies have enumerated taxonomies for conversations on Twitter (Rainie et al., 2014), but they have not considered the case of the call and response cadence we observe in this study.
In our case, respondents may retweet (RT), or may quote a tweet in response. Tweet-storms, those occurrences of a single user posting a series of tweets in sequence to make a longer argument, use these similar methods and may be detected similarly. Tweets that refer or quote previous tweets carry metadata along with them that links the new tweet with the Twitter-id of the referenced tweet.
Compounding the difficulty to track these conversations is the fact that as of this writing, the Twitter APIs do not currently support a method to directly retrieve tweets that reference a single tweet-id. Such a method would make it possible to directly traverse such a conversation tree. In the absence of this support, one must use the Twitter API to return any tweets that reference the root tweet-id and then subsequently build such a conversation tree manually.
To better manage the harvesting and integration of tweets into other online products, many software libraries have been developed to assist programmers with these issues. Popular among them are libraries like tweepy, Twitter4J, and twitteroauth. Upon further investigation, none of these libraries support the ability to harvest conversation threads like these without further development.
Fortunately, a tool called twarc (https://github.com/DocNow/twarc), developed by Ed Summers at the University of Maryland and a part of the Mellon funded DocNow project (http://www.docnow.io) was designed to specifically aid in situations like these.
Twarc provides users a set of command-line tools that accept parameters for how to appropriately harvest tweets using Twitter’s APIs. The tools intelligently handle rate limit restrictions and can gracefully wait for limits to expire to continue harvesting large conversations. Twarc has support for Twitter’s Streaming APIs which allows users to receive a notification when specific terms or features of a tweet occur in the system. These features are ideal for circumstances when you know in advance that a conversation will be happening.
For the special circumstance explored in this study, the twarc libraries also have a feature to recursively crawl a string of tweets. Users provide the ID of a tweet to start from along with the “–recursive” instruction, and the twarc libraries proceed to follow the conversation tree. The tool provides output as a JSON document and provides tools to hydrate and dehydrate tweets of their identifying details to properly adhere to Twitter’s privacy policies.
This method was used to harvest the tweets from the conversations in this study and subsequently convert the JSON documents into standard CSV formats for further analysis.
Visualization
Once a complete dataset of the conversation has been harvested from Twitter, additional methods can be used to begin to explore and understand the nature and scope of these discussions. Our hope is that by better understanding nature and metrics associated with rich conversational dialogs on twitter, we might design detection algorithms or KPIs that could teach us how to become better at initiating and hosting these kinds of conversations with our online social media audiences.
Perhaps the easiest way to get a sense of the nature and substance of the conversation is to read it. For conversations with high branching factors and multiple participants, Twitter’s default user interface quickly proves insufficient. The authors recommend a free browser extension for Chrome called Treeverse, developed by Paul Butler (https://github.com/paulgb/Treeverse). Once the browser extension is installed, it automatically detects when a tweet has replies that can be explored. By clicking on the Treeverse button, the user is given an interactive view to read the conversation directly.

The figure above shows the Treeverse interface being used to explore the tweets from Chat B. Immediately, the rich and branching nature of the discussion is obvious. The tools show us that there are three main branches of the initial tweet, but that one of them began to expand rapidly. It’s also immediately obvious that the conversation features many voices who are listening and responding to comments from the others. This shows us how Twitter conversations can behave much more like roundtable discussions than purely a call and response conversation between two individuals.
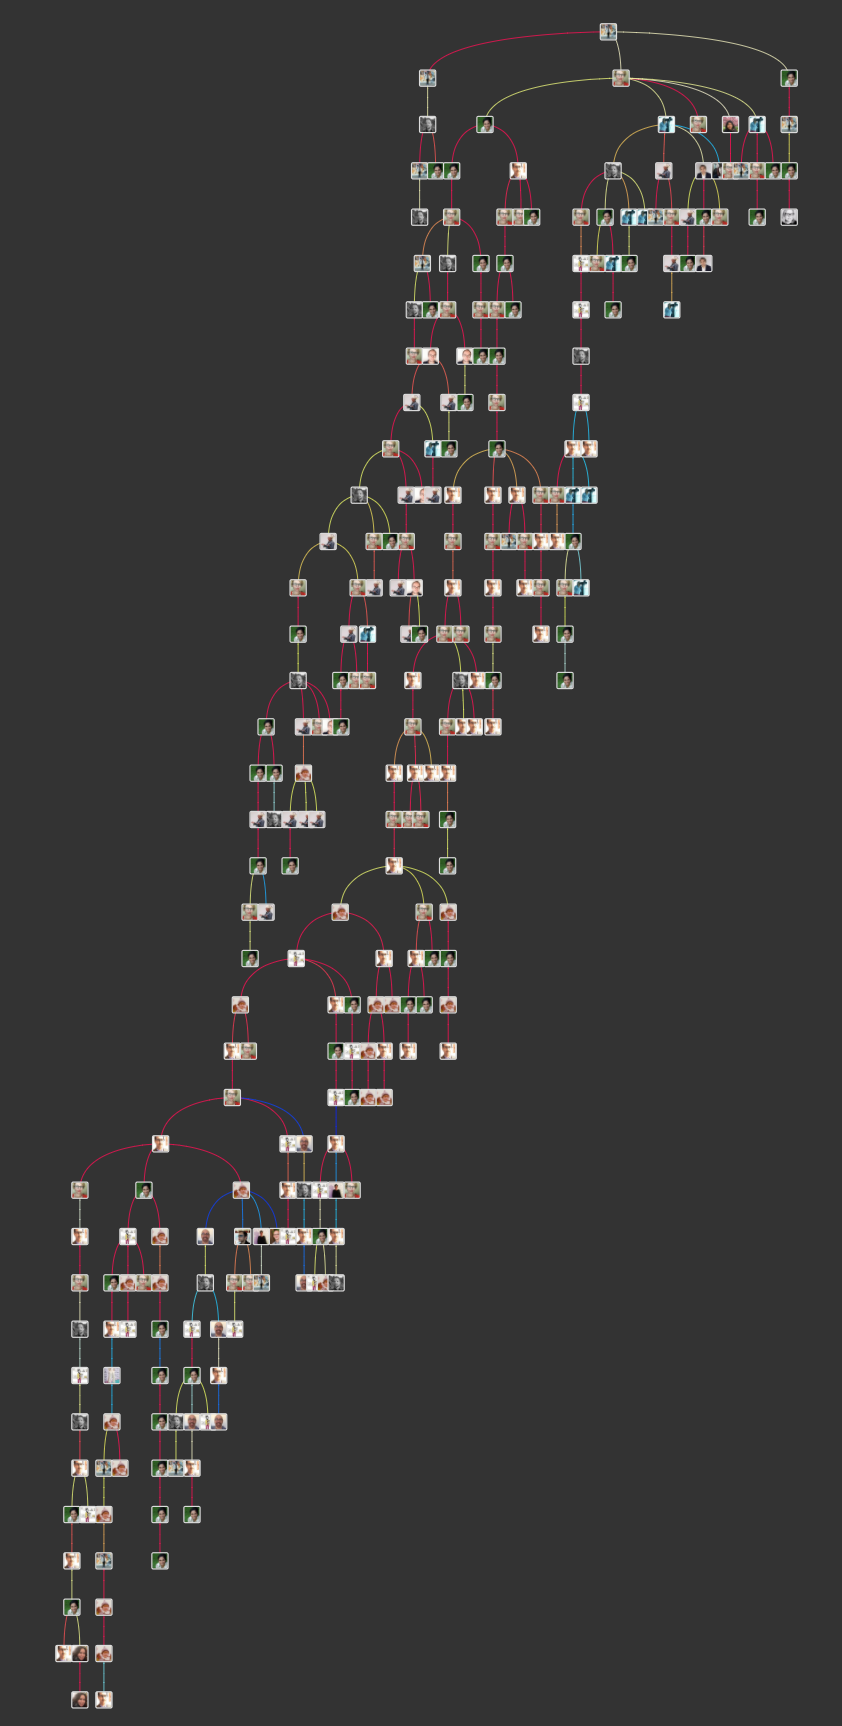
The limitations of this approach become obvious at scale as shown above. In this example, the author has expanded all branches of the discussion in an attempt to show the entire scope of Chat B. Because Treeverse is inherently an interactive application, its ability to analyze the conversation as a whole is limited. While the interface does clearly show the author of each tweet and the time between responses, it does not allow us to see any additional information about the tweet such as likes, replies, etc., and does not support any ability to perform calculations that might provide comparison metrics for contrasting conversations against each other.
For the purposes of extending the exploration of these two chats, a package called NodeXL from the Social Media Research Foundation (https://www.smrfoundation.org/nodexl/) was used as a pre-step for data conversion and preparation. NodeXL is a powerful tool that extends upon Microsoft Excel to provide the ability to calculate metrics easily.
In this example, NodeXL was used to prepare the twitter graph dataset for further visualization by converting it into GraphML, a common markup language used for graph analysis and to compute basic network metrics for each tweet, such as the following:
- In-Out Degree: the number of directed-graph edges that are inbound or outbound from each tweet
- Centrality: a measure that helps identify the most influential nodes in a graph as to their positional role in information flow across a network
- Modality: the degree to which graphs are discretely clustered
- Density: a measure of how highly interconnected the graph is
Many of these metrics can be used to compare graphs to each other, and thus provide a means to set goals for what a desirable conversation graph might look like (Himelboim et al., 2017; Raney et al., 2014).
The resulting data were exported in GraphML format and further visualized in an open-source graph visualization package called Gephi (https://gephi.org).
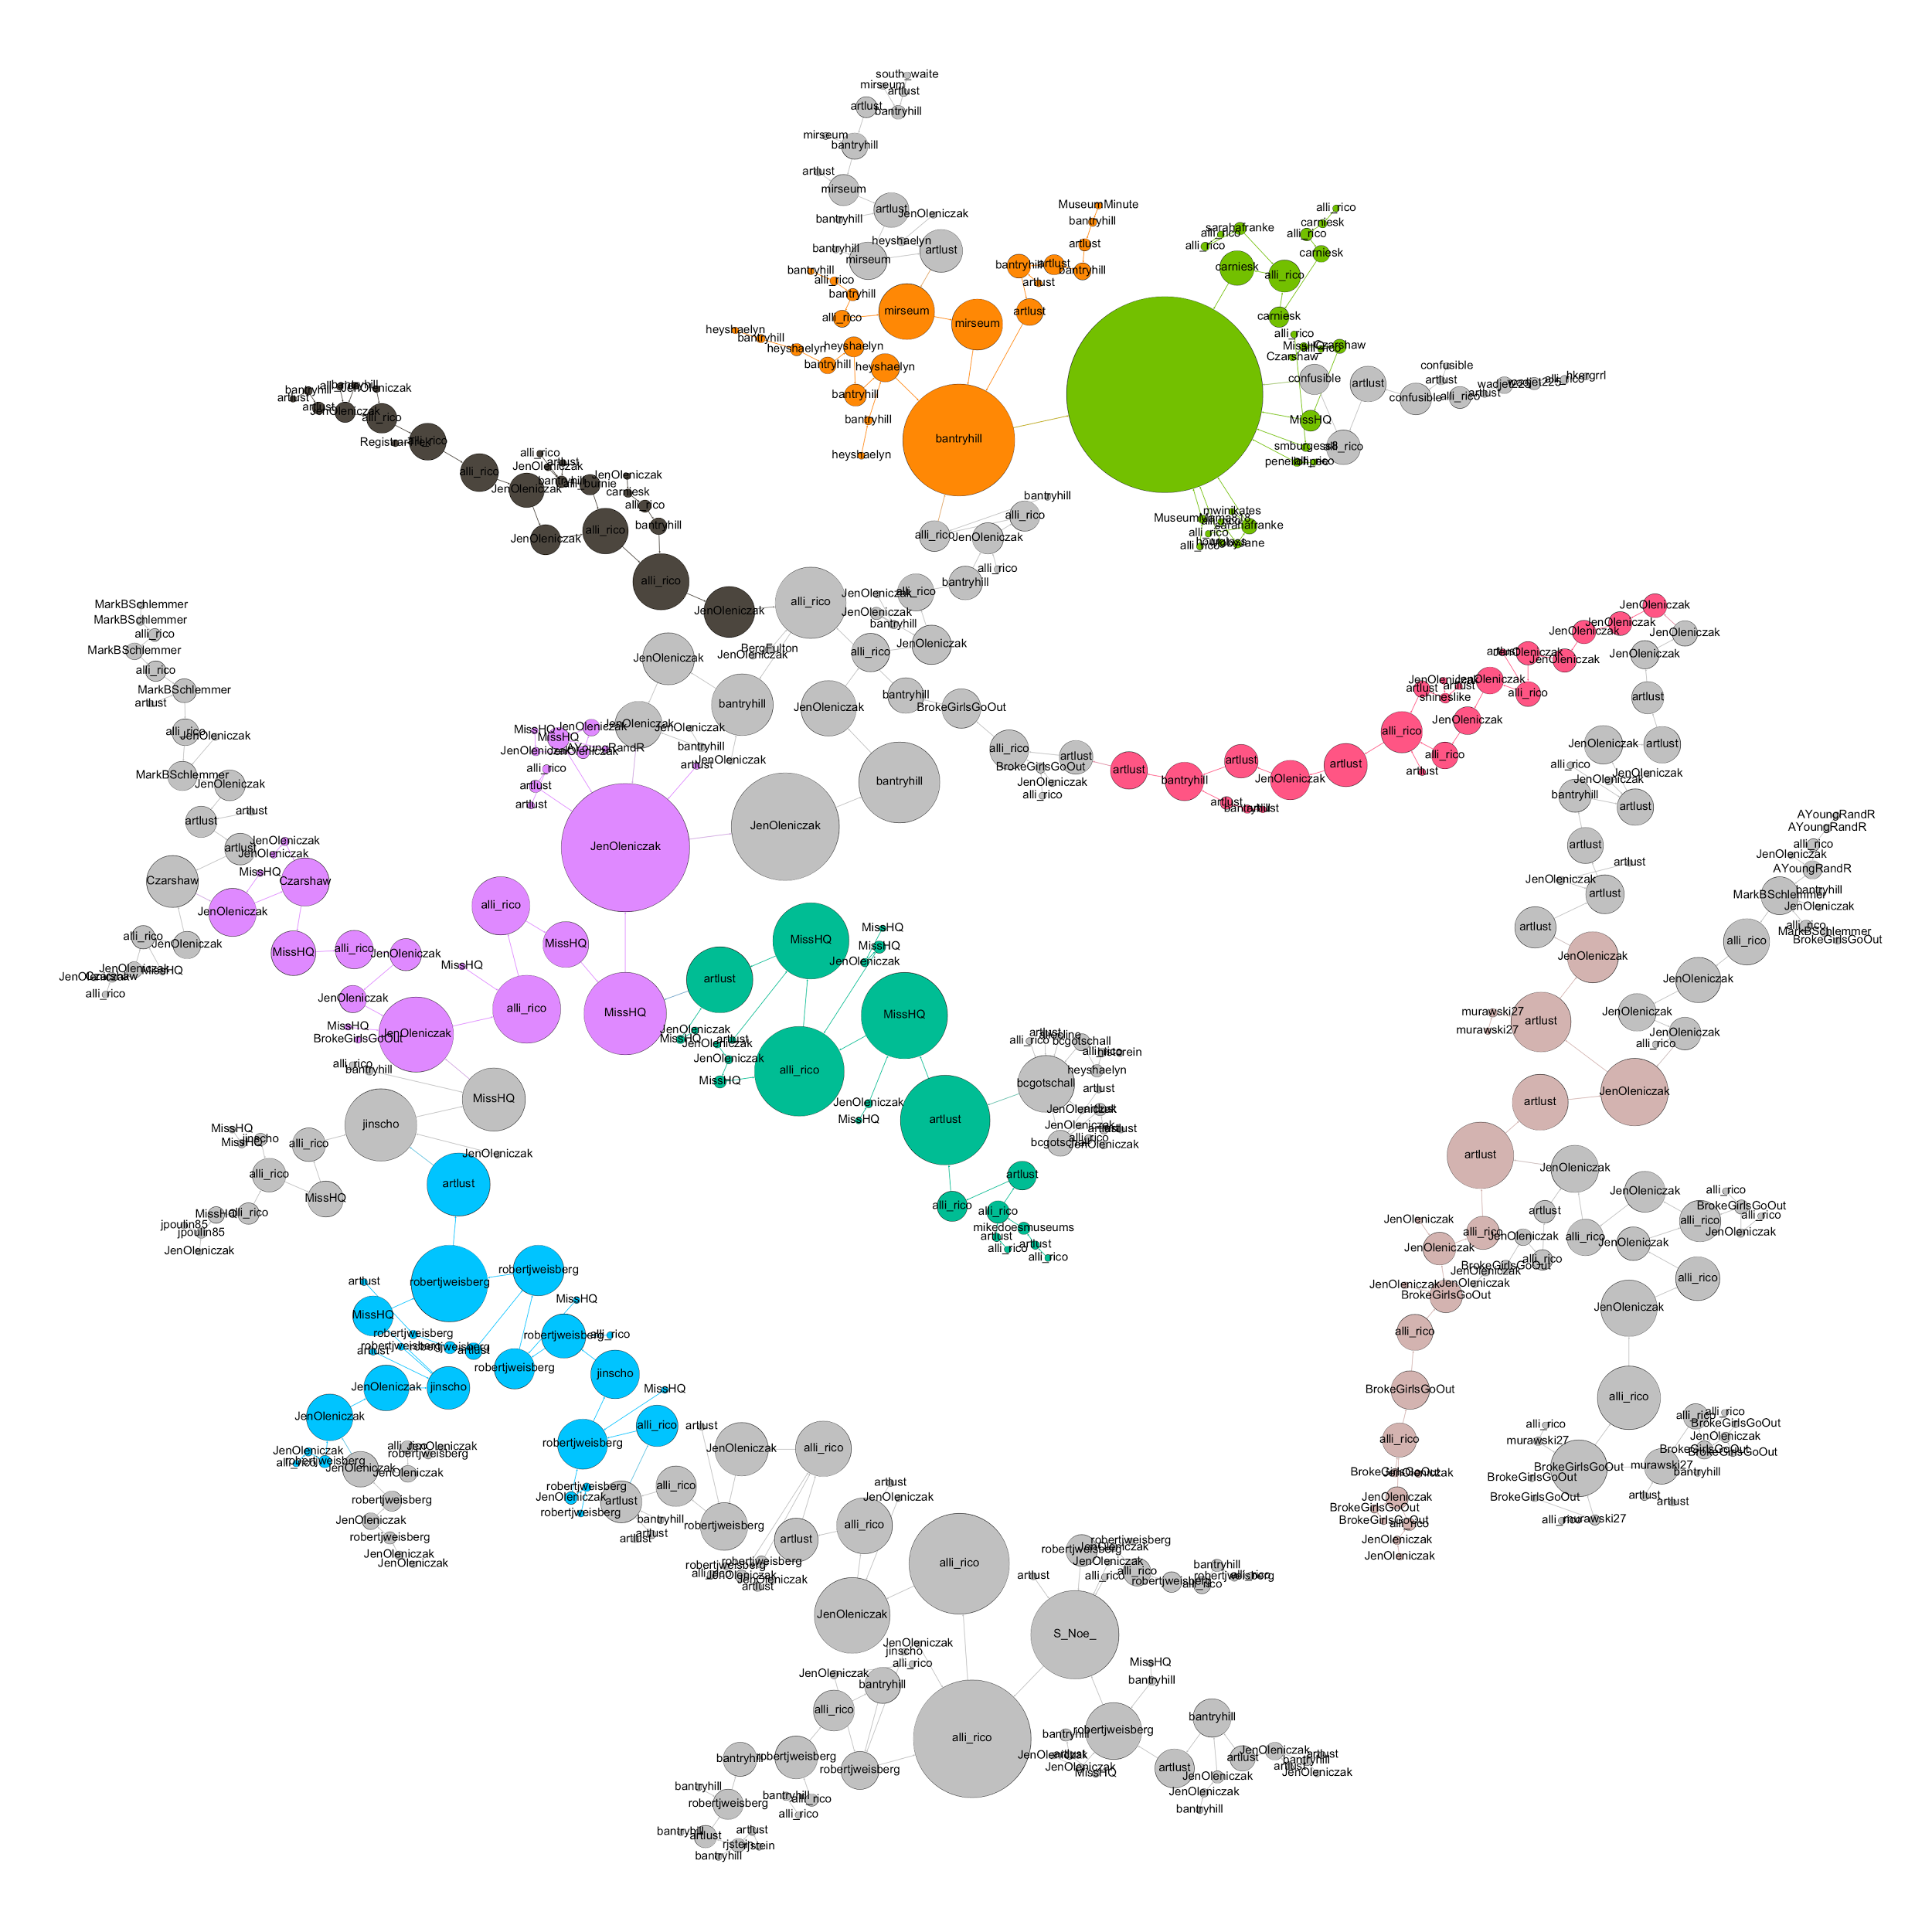
In the figure above, each tweet in the conversation is represented by the circles of the graph, and responses are linked to their corresponding tweets by the edges. The size of each node represents the number of “likes” the tweet received, and the colors represent an attempt at clustering the conversation into sub-conversations based in part on topology and changes in the patterns of response between users. The layout of the graph is ordered by several common graph-layout algorithms from the Gephi package and was chosen for clarity, compactness, and aesthetics of the resulting visualization.
The graph clearly shows that tweets with high numbers of likes frequently spawned new discussion sub-branches, and that while certain actors in the discussion recur frequently, the ability for new voices to enter the discussion and “have their say” seemed to lack the same barriers that often impede in-person conversations where it’s often described as difficult to “get a word in edgewise.”
Interesting future work on the topic would be to develop comparison metrics for chained conversations like these that are similar to those described by Himelboim et al. (2017) as applied to hashtag networks.
Textual coding and analysis
Beyond visualizing the shape and nature of these two conversations, the authors explored a variety of methods that could elucidate more qualitative measures for each chat studied. The steps taken for this analysis are as follows (the coding rubrics are available in the Appendices Section):
- Data pre-processing for each tweet is an essential first step.The harvested tweets were cleaned by stripping links and “@” symbols (Fulwood et al., 2015) (Appendix 1)
- Frequency analysis was performed on the resulting data in aggregate to understand high-frequency ideas using the free service WriteWords and visualized using WriteitOut (Clauset et al., 2004; Ciamrella et al., 2017).
- The scale of self-disclosure in each tweet was assessed. The tweets were coded as experiential (part of an experience), interpersonal (emotions/evaluative meta-content), and/or textual (defining the meaning of the words) (Zappavigna, 2015) (Appendix 2)
- The Twitter Opinion Mining framework was used, distinguishing between positive, negative, and neutral to gauge the overall emotional attitude of the conversation (Aman & Szpakowicz, 2007; Ordenes et al., 2017) (Appendix 3)
- Two new frameworks were created:
- Function in the conversation: Twitter conversations include many types of comments just as an in-person conversation would. Along with assertions and supportive agreements, conversations include additional information, moderating statements, and neutral items (Shyamasundar & Rani, 2016) (Appendix 4)
- The tone of the element: information can be shared with varying levels of feeling and tone. Therefore, the format of the statement can be useful to understand. Tweets were coded as supportive, declarative, exclamatory, interrogative, and Imperative (Vukadinovic, et al., 2014) (Appendix 5)
Results
Overall, the two chats differed drastically with Chat A being more personal and emotional than Chat B. The results highlight differences between chats that touch emotional and personal topics versus more professional conversations.
Frequency analysis
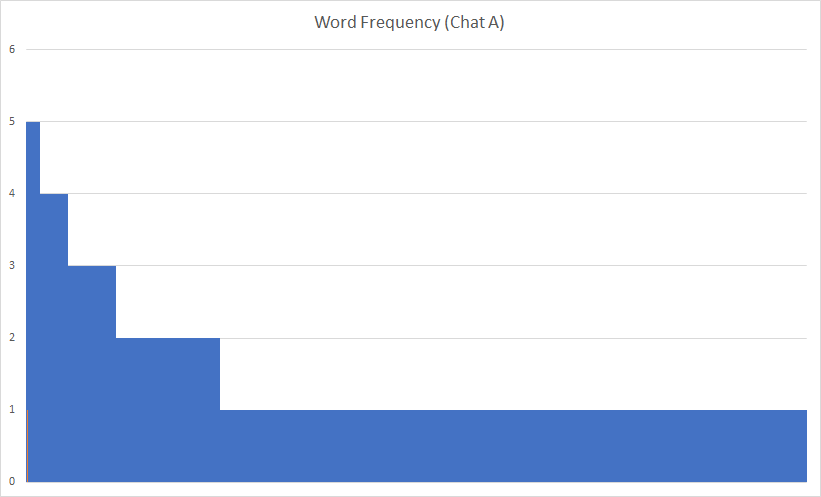
Frequency analysis has some major challenges in analyzing Twitter conversations: the number of tweets and the variety of similar expressions resulted in a disparity of words. When represented graphically, the word frequency precipitously drops to flat lines. This indicates that graphical representation is not an ideal means of representing textual data.

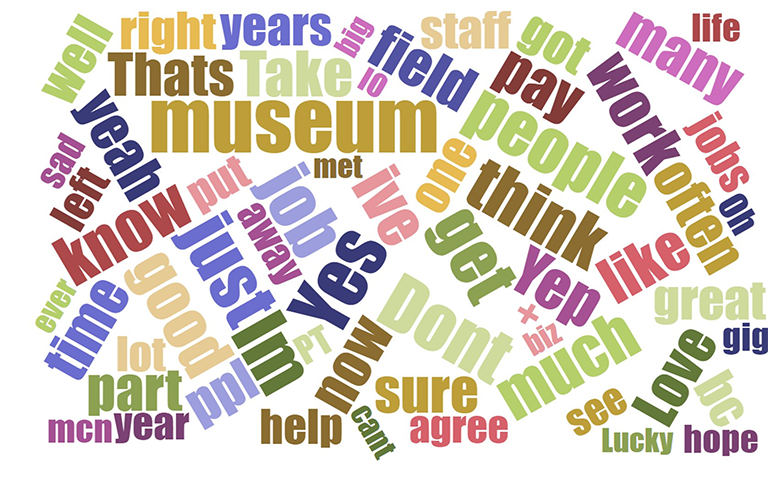
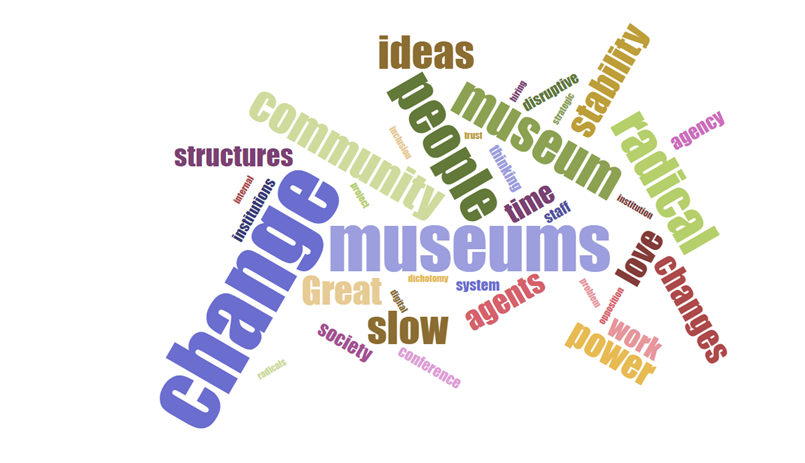
Word clouds serve as a more useful representation of topical analysis. One can quickly visually assess verbal hotspots when they occur. Additionally, words clouds represent when conversations have a high frequency of verbal convergence (as in Chat B) or high level of verbal disparity (Chat A). One important caveat, however, was the fact that this analysis was on static harvested tweet sets. In Chat A, the harvest might have missed some tweets. In other words, this harvesting method might have slightly skewed the word cloud results.
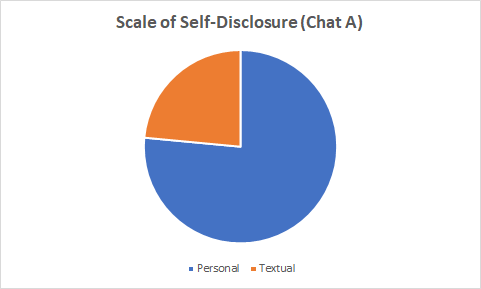
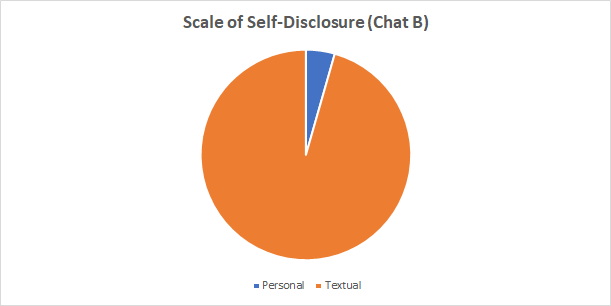
Scale of Self-Disclosure
Chat A, the longer conversation, had a much higher rate of self-disclosure. This finding is in keeping with scholarship in the field. Research indicates that Twitter conversations that have a high level of self-disclosure generally last longer. However, these same conversations also have more subjective content (Bak, Lin, and Oh, 2014).
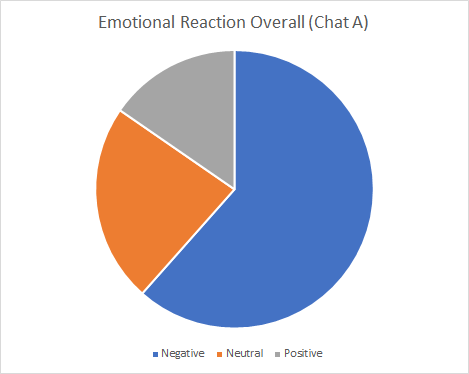
Emotional reaction
Conversations that have a high rate of self-disclosure often have a high rate of emotional content, just as this sample indicates (Bak et al., 2014). Chat A exemplifies the way that emotional Twitter conversations unfurl. For scholars, such emotional Twitter conversations can offer a useful litmus on the best types of conversations to analyze.

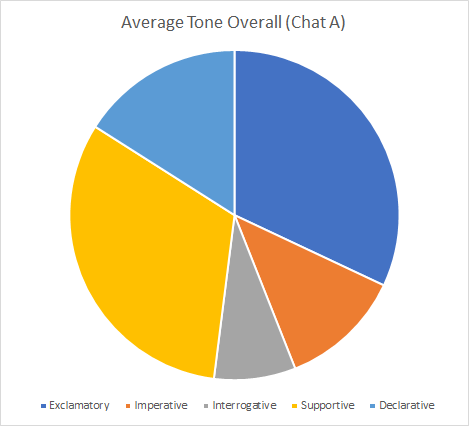
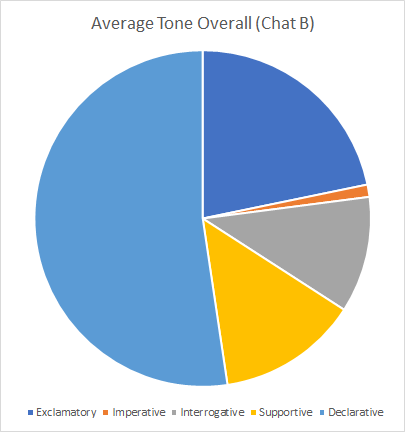
Evaluating tone
The tone of the conversation can be a tool to assess the level of objectivity of the conversation. It seems likely that a conversation with a high level of exclamatory and imperative statements is likely to have a higher level of subjectivity. However, a larger sample size would be needed to confirm these findings.
Trajectory of the conversation
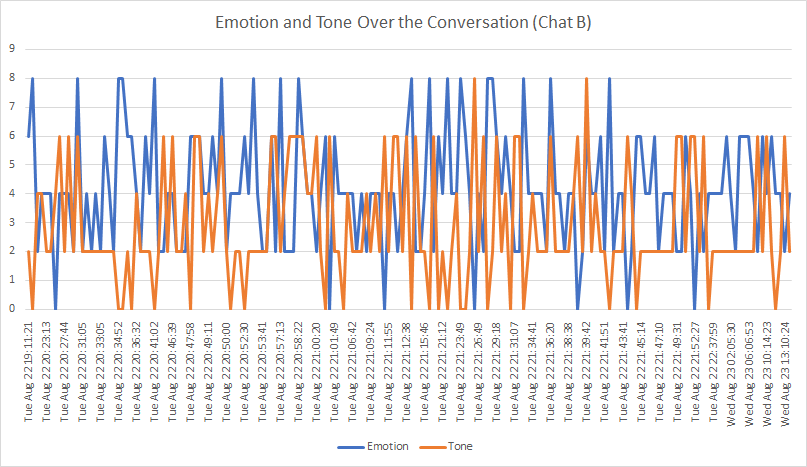
An interesting further avenue of research could be to improve upon a time-series analysis of the conversation, and a resulting graphical representation. In this example, the “emotion”and “tone” of each tweet was translated into a numerical result (based on the emoji research of Novak et. al., 2015) (See Appendices for numerical assessments). Numerical scaling allows for graphical modeling over time. For example, in Chat B, one can see temporal relationships between the emotional content and tone. Notice now both factors stop peaking near the end of the conversation, with first the tone content decreasing in frequency and then the emotion following suit.
This type of numerical assessment can be fascinating—however, this adds a layer of work for researchers. For example, this analysis was only performed on the smaller conversations as a proof of concept, as it were, and the coding took hours. The possibilities of such numerical coding would need to be investigated further to truly understand if the time spent would have scholarly value.
Taken together, these tools help lay the foundation for understanding each chat. Chat A has a high-level of personal information and feelings. As expected for conversations of this sort, there is considerable disparity in the issues, including salaries, diversity, and work/life balance. Chat B was comparatively staid with a fairly even balance in emotions and tones in the conversation. Additionally, Chat B exhibited a low level of emotional information. The word cloud showed a high rate of uniformity of sentiments. Interestingly, Chat B shared some of the same issues as Chat A, such as work/life balance and salaries.
While both twitter conversations expressed the ideas that those in the field have about challenges, why did these conversations take such different forms? The major difference between the conversations was the inclusion of interpersonal tweets in Chat A. These interpersonal/emotional tweets set the tone for conversations skewed toward truthfulness and also emotionalism.
Conclusions
Overall, these assessments can be useful tools in understanding social media conversations. The complexity of Twitter conversations, with multiple interrelated concurrent streams, are challenging to follow (Dinsoreanu & Bacu, 2014). This paper has suggested a number of approaches that museum professionals can use to do their own analysis of Twitter conversations among their peers or among the social networks connected to their museums. Further research can be done by extrapolating possible conclusions about the museum work from these particular case studies, given the richness apparent in analytic results.
While the topic of this paper was exclusively focused on the analysis of conversations on Twitter, the authors feel that similar methods can and have been successfully extended to other online social networks. As such, museum practitioners can usefully extend these methods to begin to determine which factors observed in online conversations are the most desirable for their end goals. Potential end goals might be to encourage dialog and discourse, since many followers of museums may not, in fact, be followers of each other. We ask, could discourse analysis and promotion help to connect disparate communities of followers who happen to be connected to the museum?
What are the factors and conditions that reliably result in rich online conversations? Because these conditions can be observed and studied more easily than in-person conversations, it is possible that techniques for successful online discussions might also be successful in fomenting rich and nuanced discussions in real life too.
Finally, as we grow to better understand the nature of communities and sub-communities that exist in social networks, are there ways that museums can play a role in bridging divides that exist within these communities? If—as asserted above—social networks are self-organized homophilic groups, it’s also likely that they represent communities that are similarly disassociated in real life. Better mapping and understanding of these disparities might just be an important avenue for museums to make an impact in connecting our visitors to each other, and addressing some of the most pressing needs of our communities.
Appendices
Appendix 1: data pre-processing protocol
- Confirm all tweets include full text. If not, use link to retrieve full text.
- Separate text and mentions.
- Remove all @ symbols.
- Separate emojis.
- Turn Emojis into text, i.e. 🙂 becomes smiley face
- Delete links.
Appendix 2: self-disclosure rubric
Choose only one of the following three types. For each tweet, rate based on the rubric. A single tweet might include multiple categories. If a tweet can be classified as “experiential” and any other category, classify as experiential. If a tweet is both textual and interpersonal, classify based on the percentage of characters for each category.
Experiential (must include at least one of the following):
- Employs a Hashtag for a Twitter chat or shared event
- Tags a location or event
Interpersonal (must include at least one of the following):
- Includes personal pronouns (I, me)
- shares an experience that the writer experienced
- shows a photograph taken by the tweet author
Textual:
- Information shared without personal pronouns.
Appendix 3: emotional attitude rubric
Categorize as one of the following:
Highly Positive (8)
- overall positive sentiments (love, like)
- includes hyperbole (absolutely adore, etc.)
- capital letters
- includes the verbs need, must, and/or have to
- includes more than one positive emoji (smiley face, hearts, thumbs up, checkmark)
- includes exclamation points
Positive (6)
- overall positive sentiments (love, like)
- Includes positive emojis (smiley face, hearts, thumbs up, checkmark)
Neutral (4)
- no obvious positive or negative
- has both positive and negative text
Negative (2)
- overall negative sentiments (dislike, don’t love)
- Includes negative emojis (crying face, broken heart, thumbs down, x mark)
Highly Negative (0)
- overall negative sentiments (dislike, don’t love)
- includes hyperbole (absolutely hate, abhor, etc.)
- capital letters
- includes the verbs need, must, and/or have to
- includes more than one negative emoji (crying face, broken heart, thumbs down, x mark)
- includes exclamation points
Appendix 4: function in the conversation rubric
Categorize as one of the following:
- assertion: a statement of fact or belief
- additional resource: statement solely includes a link to another site
- agreement to response: a support of someone else’s assertion, without additional assertion (I agree, totally, etc.)
- continuation of tweet: i.e. 2/2, 3/3
- moderating: asking a question or any other procedural statement (let’s be nice)
- neutral/unclassifiable: any phrase that is part of the conversation but is hard to classify
- tangent: conversation that is part of the threads of the conversation but not about the topic of the conversation
Appendix 5: tweet tone rubric
- exclamatory (8): a statement with strong emotion or an exclamation point
- imperative (6): a statement that gives a command
- declarative (4): a statement without strong emotion
- supportive (3): a declarative statement that supports another tweet without new information
- interrogative (2): a statement that elicits responses, either through the construction of the phrase or with the use of a question mark
References
Aman, S. & S. Szpakowicz. (2007). “Identifying Expressions of Emotion in Text.” In Text, Speech and Dialogue, vol. 4629. Edited by V. Matousek and P Matner, Lecture Notes in Computer Science. Springer; Berlin/ Heidelberg, pp. 196-205.
Bak, Jinyeong, C. Lin, & A. Oh. (2014). “Self-Disclosure Topic Model for Classifying and Analyzing Twitter conversations.” Proceedings of the 2014 Conference on Empirical Methods in Natural Language Processing, 1986-1996. 10.3115/v1/D14-1213.
Bakshy, E., J.Hofman, W. Mason, and D. Watts. (2011). “Everyone’s an influencer: quantifying influence on Twitter.” Proceedings of the fourth ACM international conference on Web search and Data Mining (WSDM ’11). ACM, New York, NY, USA, 65-74. DOI: https://doi.org/10.1145/1935826.1935845
Becket S. (2013). “The 2013 Twitter Glossary: Tabs, Haterreads, Doge, and More.” New York Magazine. Published December 20, 2013. Consulted February 15, 2018. Available http://nymag.com/daily/intelligencer/2013/12/2013-twitter-glossary-doge-hatereads-tabs-mansplain-meaning.html.
Bryant, A. C., & K. J. Cios (2017). “SOTXTSTREAM: Density-based self-organizing clustering of text streams.” In Plos One, 12(7). doi:10.1371/journal.pone.0180543
Ciaramella A., A. Maratea, & E. Spagno. (2018). “Semantic Maps of Twitter Conversations.” In: Esposito A., Faudez-Zanuy M., Morabito F., Pasero E. (eds) Multidisciplinary Approaches to Neural Computing. Smart Innovation, Systems and Technologies, vol 69. Springer, New York.
Clauset, A., M. E. Newman, & C. Moore. (2004). “Finding community structure in very large networks.” Physical Review E, 70(6). doi:10.1103/physreve.70.066111
Dinsoreanu, M., & A. Bacu. (2014). “Unsupervised Twitter Sentiment Classification.” In Proceedings of the International Conference on Knowledge Management and Information Sharing. doi:10.5220/0005079002200227
Espinós, Alex. (2016). “Museums on social media: Analyzing growth through case studies.” MW2016: Museums and the Web 2016. Published January 31, 2016. Consulted September 29, 2016. Available http://mw2016.museumsandtheweb.com/paper/museums-on-social-media-analyzing-growth-through-case-studies/
Espinós, Alex. (2015). “Museums on Twitter: Three case studies of the relationship between a museum and its environment.” MW2015: Museums and the Web 2015. Published January 31, 2015. Consulted September 29, 2017. Available http://mw2015.museumsandtheweb.com/paper/museums-on-twitter-three-case-studies-of-the-relationship-between-a-museum-and-its-environment-museum-professionals-on-twitter
Fullwood, C., S. Quinn, J. Chen-Wilson, D. Chadwick, & K. Reynolds. (2015). “Put on a Smiley Face: Textspeak and Personality Perceptions.” Cyberpsychology, Behavior, and Social Networking, 18(3), 147-151. doi:10.1089/cyber.2014.0463
Gonçalves, B., N. Perra, & A. Vespignani. (2011). “Modeling Users Activity on Twitter Networks: Validation of Dunbars Number.” PLoS ONE, 6(8). doi:10.1371/journal.pone.0022656
Himelboim, I., et al. (2017). “Classifying Twitter Topic-Networks Using Social Network Analysis.” Social Media Society, vol. 3, no. 1, 2017, p. 205630511769154., doi:10.1177/2056305117691545.
Kouloumpis, E., T. Wilson, & J. Moore. (2011). “Twitter sentiment analysis: The good the bad and the omg!.” Icwsm, Vol. 11, pp. 538-541 Key: citeulike:13991231
Marwick, A. & D. Boyd. (2010). “I tweet honestly, I tweet passionately: Twitter users, context collapse, and the imagined audience.” New Media & Society Vol 13, Issue 1, 114 – 33
Mcpherson, M., L. Smith-Lovin, & J. M. Cook, (2001). “Birds of a Feather: Homophily in Social Networks.” Annual Review of Sociology, 27(1), 415-444. doi:10.1146/annurev.soc.27.1.415
Mohammad, S. M., & S. Kiritchenko. (2014). “Using Hashtags to Capture Fine Emotion Categories from Tweets.” Computational Intelligence, 31(2), 301-326. doi:10.1111/coin.12024
Murthy, D. (2013). Twitter: Social Communication in the Twitter Age. New York: John Wiley & Sons.
Novak, P. K., J. Smailović, B. Sluban, & I. Mozetič. (2015). “Sentiment of Emojis.” Plos One,10(12). doi:10.1371/journal.pone.0144296
Ordenes, F. V., S. Ludwig, K. D. Ruyter, D. Grewal, & M. Wetzels. (2017). “Unveiling What Is Written in the Stars: Analyzing Explicit, Implicit and Discourse Patterns of Sentiment in Social Media.” Journal of Consumer Research. doi:10.1093/jcr/ucw070
Page, C. (2014). “Twitter has almost 430 million inactive users.” TheINQUIRER. Published April 14, 2014, Consulted February 15, 2018. Available https://www.theinquirer.net/inquirer/news/2339684/twitter-has-almost-430-million-inactive-users
Pak, A. & P. Paroubek. (2010). “Twitter as a Corpus for Sentiment Analysis and Opinion Mining.” Proceedings of LREC. 10.
Patodkar, N., N. Vaibhavi & I.R. Sheikh. (2016). “Twitter as a Corpus for Sentiment Analysis and Opinion Mining.” IJARCCE. 5. 320-322. 10.17148/IJARCCE.2016.51274.
Peterson, A. (2014). “The Six Types of Conversations on Twitter.” The Washington Post, WP Company, Published February 20, 2014. Consulted February 15, 2018. Available www.washingtonpost.com/news/the-switch/wp/2014/02/20/the-six-types-of-conversations-on-twitter/?utm_term=.819d7b83973e.
Rainie, L. (2014). “The six types of Twitter conversations.” Published February 20, 2014. Consulted February 15, 2018. Available http://www.pewresearch.org/fact-tank/2014/02/20/the-six-types-of-twitter-conversations
Scarola, C. (2017). “Twitter Canoes Are About to Get a Lot Bigger.” Published March 30, 2017. Consulted February 15, 2018. Available https://www.inverse.com/article/29756-twitter-canoes-everybody-get-in
Schantl, J., R. Kaiser, J. Wagner, & M. Strohmaier. (2013). “The utility of social and topical factors in anticipating repliers in Twitter conversations.” In Proceedings of the 5th Annual ACM Web Science Conference (WebSci ’13). ACM, New York, NY, USA, 376-385. DOI=10.1145/2464464.2464481
Shyamasundar, L. B., & P. J. Rani. (2016). “Twitter sentiment analysis with different feature extractors and dimensionality reduction using supervised learning algorithms.” 2016 IEEE Annual India Conference (INDICON). doi:10.1109/indicon.2016.7839075
Smith, M. A., et al. (2014). “Mapping Twitter topic networks: From polarized crowds to community clusters.” Pew Research Center.
“Twitter MAU worldwide.” (2017). Statista. Published January 29, 2017. Consulted February 15, 2018. Available https://www.statista.com/statistics/282087/number-of-monthly-active-twitter-users/
Vukadinovic, D., D. Greetham, & J. A. Ward. (2014). “Conversations on Twitter: structure, pace, balance.” In: 2nd International Workshop on Dynamic Networks and Knowledge Discovery (DyNaK II), 15 September 2014, Nancy, France. (ISSN 1613-0073)
Zappavigna, M. (2015). “Searchable talk: the linguistic functions of hashtags.” Social Semiotics, 25(3), 274-291. doi:10.1080/10350330.2014.996948
Cite as:
Rao, Seema and Stein, Robert. "To journey in Twitter canoes: Methods to understand the mechanisms and meaning in Twitter conversations." MW18: MW 2018. Published February 6, 2018. Consulted .
https://mw18.mwconf.org/paper/to-journey-in-twitter-canoes-methods-to-understand-the-mechanisms-and-meaning-in-twitter-conversations/